User Guide: Introduction to the features in the Peptide Property Calculator tool.
1. Features in the tool
| The figure below (fig 1) shows the first screen – The main page of peptide property calculator tool |
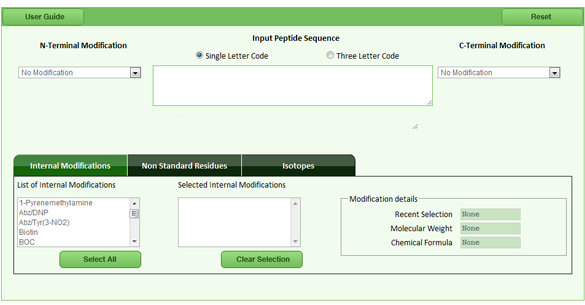 |
| Fig 1: The main screen of the peptide property calculator |
| Introduction to Peptide Modifications (N-Terminal, C-Terminal, Internal Modifications
and Non Standard Residues) Peptide modification is to mark the peptide with specific dyes or to simulate the functions of the peptide. Each modification has specific use with respect to the peptides. E.G.1: Succinylate group is often added at the C-Terminal to activate it. When added as the hydrosuccinimide ester, it makes the carboxyl group reactive to amines. E.G.2: Myristic acid is added to make the peptide much more hydrophobic and used for antibody generation. |
a. N-terminal modification |
| N-Terminal modification is used to add various chemical groups to the N-Terminal region of the peptide/protein sequence. The below figure (fig 2) displays the list of N-Terminal Modifications that can be added to the peptide/protein sequence |
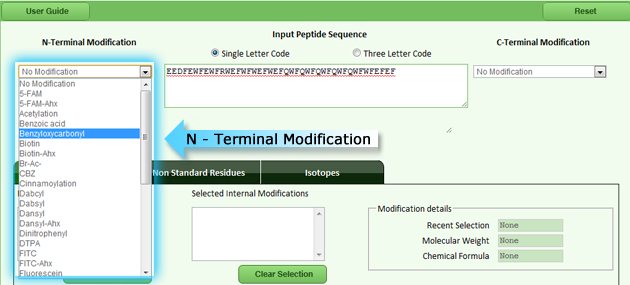 |
| Fig 2: List of N-terminal modifications |
b. C-terminal modification |
| C-Terminal modification is used to add various chemical groups to the C-Terminal region of the peptide/protein sequence. The below figure (fig 3) displays the list of C-Terminal Modifications that can be added to the peptide/protein sequence |
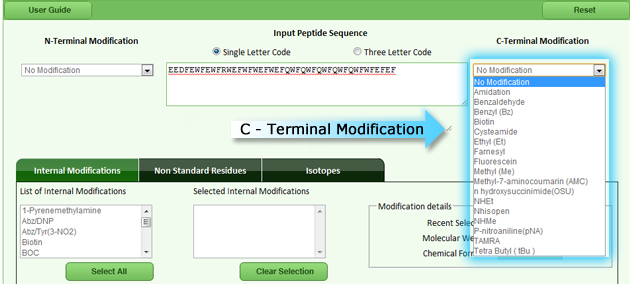 |
| Fig 3: List of C-terminal modifications |
c. Internal modification |
|
Internal modification allows the user to modify N-terminal or C-terminal or within the peptide by using many functional groups like p-nitroalniline, succinylation, mryistoylation, etc. E.G: The P-nitroanilide group is often used as an enzyme substrate. When the group is cleaved off a peptide there is a large change in the UV spectrum which can easily be monitored. The various chemical groups which can be added within the region of the peptide/protein sequence are displayed in the below figure (fig 4) |
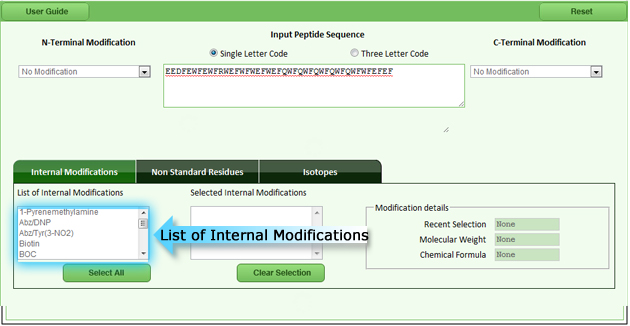 |
| Fig 4: List of internal modifications |
d. Non standard residue |
| Non standard residues are synthetic amino acids, they are also known as unusual amino acids. They are represented by three letter or single letter code. E.G.: “2-Aminoisobutyric acid” is represented by “Aib” The various chemical groups which can be added to the terminal region or inserted to the peptide/protein sequence are displayed in the below figure (fig 5) |
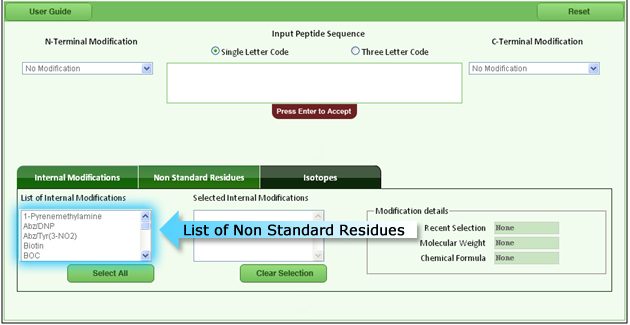 |
| Fig 5: List of non standard residues |
e. Addition of isotope |
| The user can add isotopes to any specific amino acid in the peptide/protein sequence which are displayed in the below figure (fig 6) |
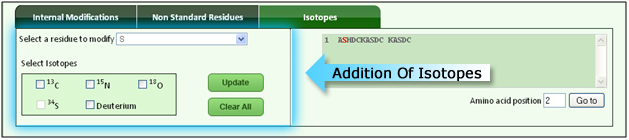 |
| Fig 6: Addition of isotope |
2. Various output for the input sequence
| The output from the tool has been grouped into 6 major headings. | |
| 1. Basic Information 2. pH and Isoelectric Point 3. Hydrophobicity and Hydrophilicity 4. Secondary Structure Prediction 5. Transmembrane Prediction 6. Surface Probability and Protein Flexibility |
|
| The user can view the results by clicking on the respective tabs fig 7 | |
 |
|
| Fig 7: The output from the tool is broadly categorized into 6 major heads | |
a. Basic information |
| The initial output displayed after the click of “Calculate button” is the Basic Information | |
Basic Information contains the following outputs: |
|
|
 |
| Fig 8: General information | |
|
 |
| Fig 9: Sequence composition | |
|
 |
| Fig 10: Interpreted sequence and amino acid composition | |
b. pH and Isotopes |
| Click on “pH and Isoelectric point” | |
 |
|
| pH and Isoelectric Point contains the following outputs: | |
| 1. Isoelectric Point 2. Net Charge at pH 7 3. Charge 4. Charge Attribute 5. Hydrophobicity at pH 2.0 6. Hydrophobicity at pH 6.8 |
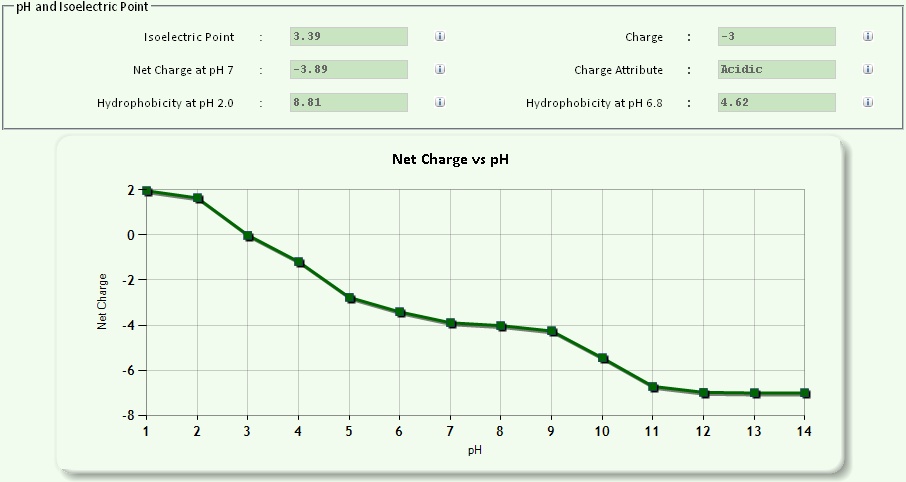 |
Fig 11: Isoelectric point , hydrophobicity at 2 different pH range and charge |
|
c. Hydrophilicity and hydrophobicity |
| Click on “Hydrophilicity and Hydrophobicity tab” | |
 |
|
| Hydrophilicity and Hydrophobicity contains the following outputs: | |
| 1. Kyte-Doolittle Hydrophobicity 2. Janin Hydrophobicity 3. Parker Antigenicity Plot 4. Fauchere Hydrophobicity 5. Manavalan Hydrophobicity 6. Sweet / Eisenberg Hydrophobicity 7. von Heijne Hydrophilicity 8. Welling Antigenicity Plot 9. Hopp-Woods Antigenicity Plot 10. Goldman, Engelberg and Steitz (GES) Hydrophilicity 11. Protrusion Index (Thornton) Antigenicity Plot |
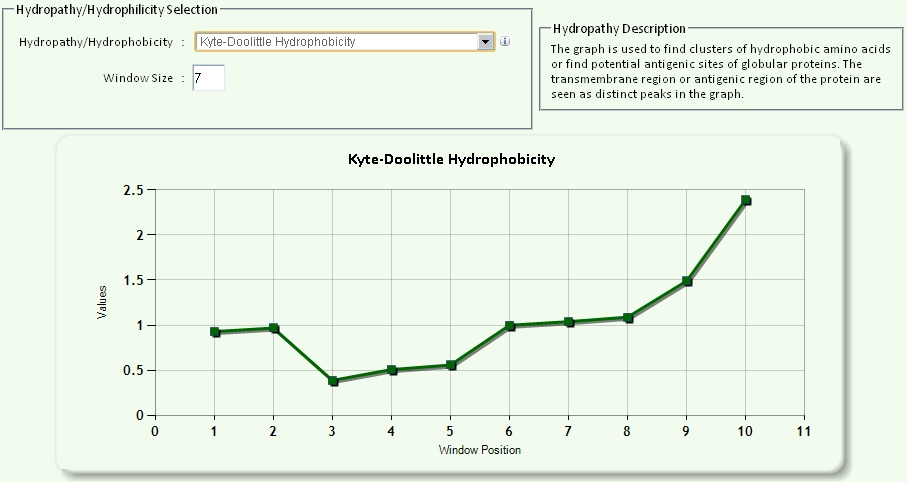 |
Fig 12: Hydrophobicity and hydrophilicity |
|
| Window size A window size is the number of amino acids whose hydrophobicity/hydrophilicity scores will be averaged and assigned to the first amino acid in the window. Here the algorithm calculates the average of all the hydrophobicity/hydrophilicity scores in that window. Then the computer program moves down one amino acid and calculates the average of all the hydrophobicity scores in the second window. This pattern continues to the end of the protein. The averages are then plotted on a graph. The y axis represents the hydrophobicity scores and the x axis represents the window number. Window size of 5-7 is good for finding hydrophilic regions and Window size of 19-21 will make hydrophobic, membrane-spanning domains stand out rather clearly. Example: Window Size=10 MIDRPEGAKEGKGSSKVGKGQGKEKKGLEKGGKELEKGGKVSEKGGKGLE 1st Window: MIDRPEGAKEG MIDRPEGAKEGKGSSKVGKGQGKEKKGLEKGGKELEKGGKVSEKGGKGLE 2nd Window: IDRPEGAKEGK MIDRPEGAKEGKGSSKVGKGQGKEKKGLEKGGKELEKGGKVSEKGGKGLE 3rd Window: DRPEGAKEGKG : : : : MIDRPEGAKEGKGSSKVGKGQGKEKKGLEKGGKELEKGGKVSEKGGKGLE Final Window: VSEKGGKGLE |
|
d. Secondary structure prediction |
| Click on “Secondary Structure Prediction tab” |
 |
| Secondary Structure Prediction contains the following outputs:(see Fig 13) |
|
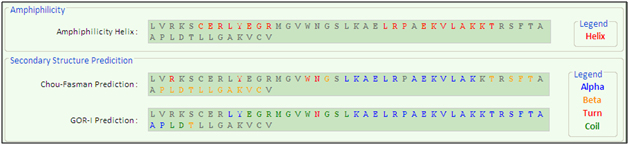 |
Fig 13: Secondary structure prediction |
e. Transmembrane region prediction |
| Click on “Transmembrane Regions tab” |
 |
| Transmembrane region prediction contains the following outputs:(see Fig 14) |
|
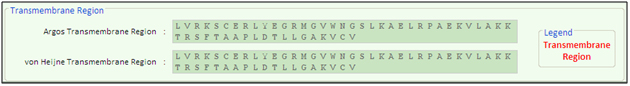 |
Fig 14: Transmembrane region |
f. Surface probability and protein flexibility |
| Click on “Surface Probability and Protein Flexibility tab” |
 |
| Surface Probability and Protein Flexibility contains the following outputs:(see Fig 15) |
|
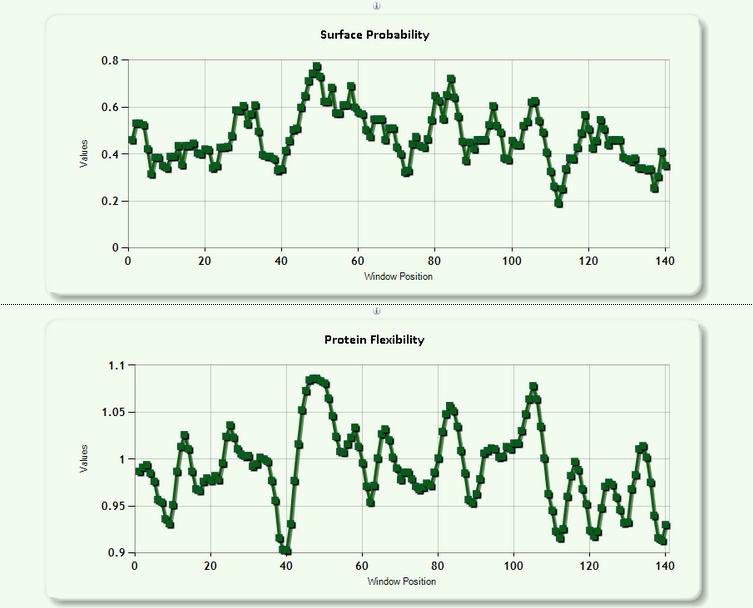 |
Fig 15: Surface probability and protein flexibility |